Frequency Selective Wave Analyzer:
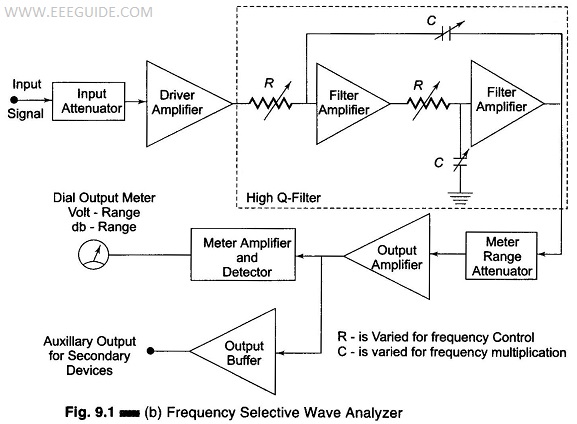
The Frequency Selective Wave Analyzer consists of a very narrow pass-band filter section which can be tuned to a particular frequency within the audible frequency range (20 Hz – 20 kHz). The block diagram of a wave analyzer is as shown in Fig. 9.1(b).
The complex wave to be analyzed is passed through an adjustable attenuator which serves as a range multiplier and permits a large range of signal amplitudes to be analyzed without loading the amplifier.
The output of the attenuator is then fed to a selective amplifier, which amplifies the selected frequency. The driver amplifier applies the attenuated input signal to a high-Q active filter. This high-Q filter is a low pass filter which allows the frequency which is selected to pass and reject all others. The magnitude of this selected frequency is indicated by the meter and the filter section identifies the frequency of the component. The filter circuit consists of a cascaded RC resonant circuit and amplifiers. For selecting the frequency range, the capacitors generally used are of the closed tolerance polystyrene type and the resistances used are precision potentiometers. The capacitors are used for range changing and the potentiometer is used to change the frequency within the selected pass-band, Hence this wave analyzer is also called a Frequency selective voltmeter.
The entire AF range is covered in decade steps by switching capacitors in the RC section.
The selected signal output from the final amplifier stage is applied to the meter circuit and to an untuned buffer amplifier. The main function of the buffer amplifier is to drive output devices, such as recorders or electronics counters.
The meter has several voltage ranges as well as decibel scales marked on it. It is driven by an average reading rectifier type detector.
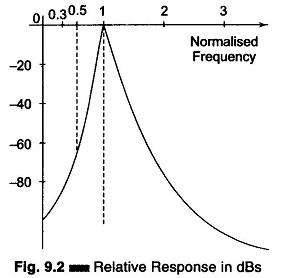
The wave analyzer must have extremely low input distortion, undetectable by the analyzer itself. The bandwidth of the instrument is very narrow, typically about 1% of the selective band given by the following response characteristics. (Fig. 9.2).

