Bode Plot in Network Analysis:
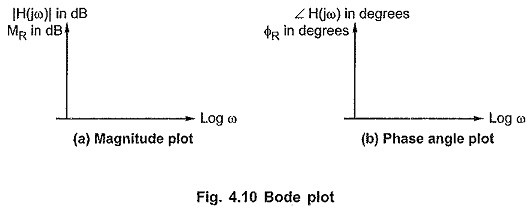
The Bode Plot in Network Analysis is a popular method to obtain the frequency response of the networks. It basically sketches the variations in MR and ΦR against the frequency ω but uses a logarithmic scale for ω, to accommodate large range of frequency within a small distance. Similar to the frequency response, the Bode plot also consists of two plots,
- Magnitude plot
- Phase angle plot
Magnitude Plot:
The scientist Bode suggested to express MR in decibel (dB) to plot against Log (ω). Such a dB value of MR can be obtained as,
Such dB values are obtained for various values of ω from 0 to ∞ and are plotted against Log10 ω.
The magnitude plot is shown in the Fig. 4.10 (a).
Phase Angle Plot:
The ∠ H(jω) i.e. ΦR is obtained in degrees for various values of ω and are plotted against Log10 ω.
The phase angle plot is shown in the Fig. 4.10 (b).
