Frequency Domain Analysis in Network Analysis Articles:
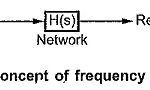
Frequency Domain Analysis: As we now already, the responses of the networks to the various time dependent inputs such as step, ramp, exponential etc. are studied. Let us now discuss the response by the network to a … (Read More)
Frequency Domain Network Function: As the frequency domain network function is a complex function, it can be expressed mathematically in two ways i.e. using rectangular coordinates or using polar coordinates. In rectangular coordinates it can be written as, R(ω) = Re = Real … (Read More)
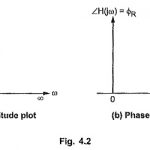
Magnitude Plot and Phase Angle Plot: As mentioned earlier, the polar coordinate system is very commonly used to obtain the frequency response. The frequency ω is always an independent variable while the magnitude part … (Read More)
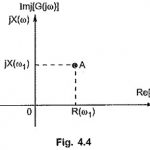
Complex Locus of RLC Networks: The network function G(s) or H(s) can be impedance function or an admittance function hence referred as immitance function. In the frequency domain G(jω) or H(jω) can be represented in … (Read More)
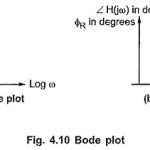
Bode Plot in Network Analysis: The Bode Plot in Network Analysis is a popular method to obtain the frequency response of the networks. It basically sketches the variations in MR and ΦR against the frequency ω but uses a logarithmic scale … (Read More)
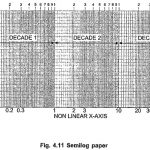
Logarithmic Scale or Semi Log Graph Sheet: To sketch the magnitude in dB and phase angle in degrees against Log ω, the logarithmic scale is used. This is available on semilog graph paper. In such paper the X-axis is divided into … (Read More)
Specification from Bode Plot: The important Specification from Bode Plot are, Gain cross-over frequency (ωgc) Phase cross-over frequency (ωpc) Gain margin (G.M.) Phase margin (P.M.) Gain Cross-over Frequency (ωgc): The frequency at which the magnitude of system function is unity i.e. 0 dB is called gain cross … (Read More)