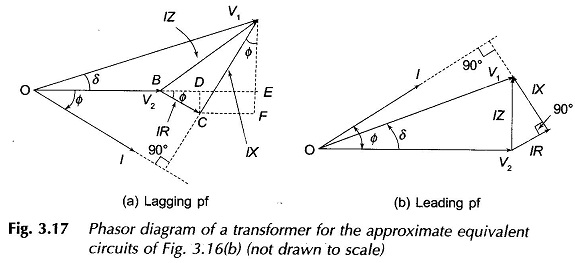
Phasor Diagram of Transformer:
For the approximate equivalent circuit of Phasor Diagram of Transformer is shown in Fig. 3.16(b)

The phasor diagram corresponding to this equation is drawn in Fig. 3.17(a) for the
lagging power factor (phase angle Φ between V2 and I) and in Fig. 3.17(b) for the leading power factor (pf). It is immediately observed from these phasor diagrams that for the phase angle indicated
It will be shown already that V2 > V1 only when leading phase angle Φ is more than tan-l (R/X).
In the phasor diagrams of Fig. 3.17(a) and (b) (these are not drawn to scale), the angle δ is such that V1 leads V2. This is an indicator of the fact that real power flows from side 1 to side 2 of the transformer. This angle is quite small and is related to the value of the equivalent reactance: resistance of the transformer being negligible.

