What is Load Curve?:
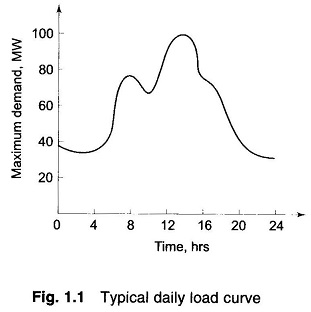
Load drawn by consumers is the toughest parameter to assess scientifically. The magnitude of the load, in fact, changes continuously so that the load forecasting problem is truly a statistical one. A typical daily Representation of Load Curve is shown in Fig. 1.1.
The loads are generally composed of industrial and domestic components. An industrial load consists mainly of large three-phase induction motors with sufficient load constancy and predictable duty cycle, whereas the domestic load mainly consists of lighting, heating and many single-phase devices used in a random way by householders. The design and operation of power systems both economically and electrically are greatly influenced by the nature and magnitude of loads.
In representation of Load Curve for various system studies such as load flow and stability studies, it is essential to know the variation of real and reactive power with variation of voltage. Normally in such studies the load is of composite nature with both industrial and domestic components. A typical composition of load at a bus may be
Though it is always better to consider the P-V and Q-V characteristics of each of these loads for simulation, the analytic treatment would be very cumbersome and complicated. In most of the analytical work one of the following three ways of load representation is used.
1. Constant Power Representation:
This is used in load flow studies. Both the specified MW and MVAR are taken to be constant.
2. Constant Current Representation:
Here the load current is given by Eq. (4.17), i.e.
where V = |V| ∠ δ and θ = tan-1 Q/P is the power factor angle. It is known as constant current representation because the magnitude of current is regarded as constant in the study.
3. Constant Impedance Representation:
This is quite often used in stability studies. The load specified in MW and MVAR at nominal voltage is used to compute the load impedance (Eq. (4.22b)). Thus
which then is regarded as constant throughout the study.


