Spectrum Analyzer Block Diagram
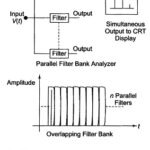
Spectrum Analyzer Block Diagram: Spectrum Analyzer Block Diagram - The most common way of observing signals is to display them on an oscilloscope, with time as the X-axis (i.e. amplitude…
Harmonic Distortion Analyzer: A Harmonic Distortion Analyzer measures the total harmonic power present in the test wave rather than the distortion caused by each component. The simplest method is to…
Heterodyne Wave Analyzer: Wave analyzers are useful for measurement in the audio frequency range only. For measurements in the RF range and above (MHz range), an ordinary wave analyzer cannot…
Frequency Selective Wave Analyzer: The Frequency Selective Wave Analyzer consists of a very narrow pass-band filter section which can be tuned to a particular frequency within the audible frequency range…
What is Wave Analyzer?: It can be shown mathematically that any complex waveform is made up of a fundamental and its harmonics. It is often desired to measure the amplitude…
Color Bar Generator: The composite video signal at the output of a video detector consists of luminance Y signals, the chrominance signal, the color burst, sync pulses and blanking pulses.…
Marker Generator Block Diagram: Marker Generator - The sweep generator provides a visual display of the characteristics of the circuit or amplifier, but this is inadequate because it does not…
RF Signal Generator: An RF signal generator, when used for alignment and testing of the RF and IF stages of a TV receiver, permits recording of circuit performance at one…