Spot Wheel Method for Frequency Measurement:
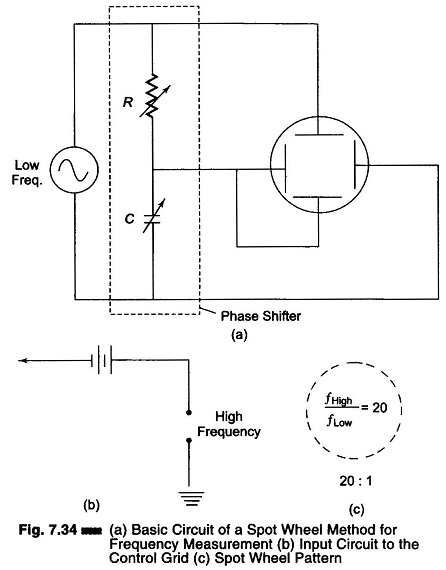
As the ratio of the two frequencies being compared increases, the Lissajous pattern becomes more complicated and hence more difficult to interpret. In such cases, it is advantageous to use the Spot Wheel Method for Frequency Measurement of display as shown in Fig. 7.34 (a) whereby an intensity modulated circular or elliptical is produced on the face of the CRT. The lesser of the two frequencies being compared is applied to the deflecting plates of the CRT through the resistance-capacitance phase shifter as illustrated, thereby producing the circular (or elliptical) sweep.
The higher frequency is applied to the control grid of the CRT (biased slightly below cut off), as shown in Fig. 7.34 (b), thus modulating the intensity of the beam. As a consequence, the pattern appears as a series of alternate bright and dark spots, as shown in Fig. 7.34 (c), where the ratio of the high to low frequencies is given by the number of bright spots.
The application of two sine wave signals, equal in amplitude but 90° out of phase, to the vertical and horizontal deflecting plates results in the formation of a circle. If a single sine wave is applied to a phase shifting circuit, it is possible to obtain two outputs, equal in amplitude and 90° out of phase.
If the voltages across R and C are equal, the pattern is a circle. If they are unequal, the pattern is elliptical.
(R = 1/ωC where to = 2πf. The voltage across C lags the voltage across R by 90°.)
Varying the grid-cathode potential changes the density of the electron stream within the CRT and determines the intensity. When the grid bias of the CRT reaches cut off potential, there is no electron stream and fluorescence at the screen cannot occur. This property is used for the comparison of two frequencies, provided their ratio is an integer.
The high frequency signal is applied to the grid. Sufficient grid bias must be present so that the negative peaks of the sine wave cut off the electron beam. The high frequency signal does not have to be a pure sine wave, it can be a square wave. I
n Fig. 7.34 (c), the frequency is 20 : 1 and there are 20 blanks in the Spot Wheel Method for Frequency Measurement pattern.
