Stability from Bode Plot of Open Loop Transfer Function:
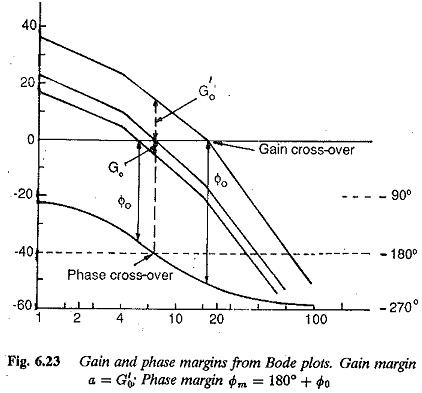
The Nyquist criterion details how the open loop polar plot can be used for establishing. the stability of a closed loop system. In terms of phase and gain margins it has been concluded that a minimum phase function should have positive values of phase and gain margins for stable operation. Bode plot of open loop transfer function can also be used to ascertain the stability (both absolute and relative) of a closed loop system. The phase and gain margins can be easily determined from these plots. Referring to Fig. 6.23 the gain margin is the reciprocal of the open loop magnitude ratio of the transfer function at a phase of —180°. When measured in decibels it is the negative of the actual magnitude ratio at the phase of —180° or phase cross-over.
A stable system has positive gain margin. From the same figure it can be seen that the phase margin is 180°+ phase of the open loop transfer function at the gain cross-over frequency (when the gain of the function is unity or 0 db).
With the knowledge of these margins and phase and gain cross-over frequencies, Bode plot can be used to ascertain the stability of the system. Using the fact that the phase margin is positive for a stable system, we may conclude that such a situation occurs if the gain cross-over occurs earlier than the phase cross-over or in other words the gain cross-over frequency is less than phase cross-over frequency. The system is marginally stable if both occur simultaneously and the system is unstable if the phase cross-over occurs before gain cross-over. The increase in the gain constant of a system has a tendency to raise the log-magnitude plot vertically upwards without altering the phase plot.
This shifts the gain cross-over to the left, or effectively the gain cross-over frequency decreases. The system therefore tends to become unstable.
The Bode plot are therefore used to adjust the parameters, such as gain and time constants of the system, to obtain the required phase and gain margins. They can also be used to design the controllers to improve the system performance by bringing the margins to the specified minima. It has been stated that for adequate stability the phase margin must be greater than 45° and gain margin > 1.5.
The shape of the Bode plot and its slope at the gain cross-over also indicate the stability of the system. A factor of the nature 1/(1 + jωT) has a slope of -20 db/decade and an angle changing from 0° at lower frequencies to -90° at higher frequencies. Several such factors affect the slope of the log-magnitude curve and the phase angle. A slope of -20 db/decade may be related to -90° whereas a slope of -40 db/decade to an angle of -180°. Hence for a stable system the log-magnitude curve should be more gradual than -40 db/decade. The preferable slope is -20 db/decade at gain cross-over frequency. The system is unstable if the slope is -60 db/decade.
The shape of the curve at low frequencies determines the type of system and steady-state accuracy. The speed of response of a system is indicated by the frequency at phase margin.
